Dashboard creation: Figures on combined transport - interactive
Project description
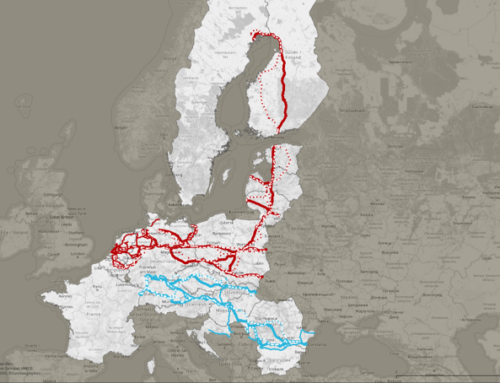
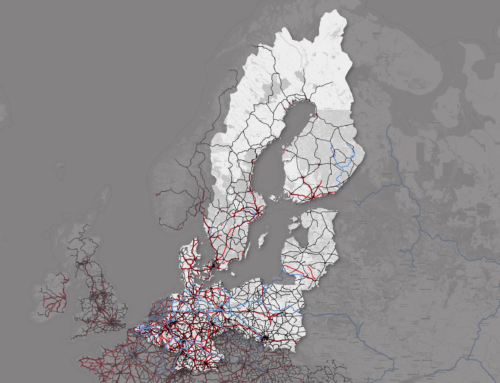
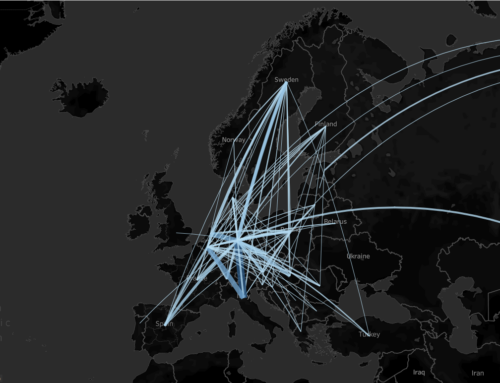
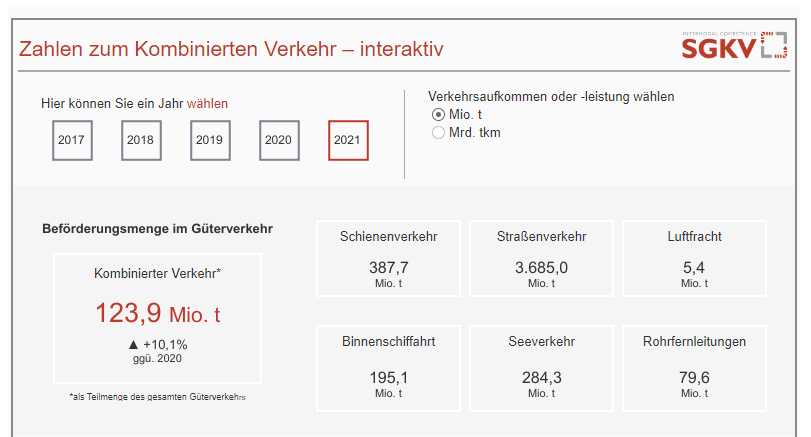
For many years, the SGKV (Studiengesellschaft für den Kombinierten Verkehr e.V.) has been offering a wide range of services on its homepage "Facts and figures", an information brochure with numerous data-based illustrations relating to combined transport. The product has so far only been made available for download as a PDF file, initially for members and later also for the public.
In addition, the SGKV now also offers an interactive presentation of core combined transport statistics on its homepage; accessible to all interested parties. I used Tableau to implement this clear visualisation in the form of a dashboard. I also supported the client in implementing the dashboard on the SGKV homepage and gave her an introduction to the use of Tableau Public.
Further information
Period
March to May 2023

Project partners
none
Keywords
Combined transport
Data
Dashboard
Tableau